Graph - Line section
A line graph section displays time-series data as continuous lines, making it ideal for visualizing trends and patterns over time. Unlike grids that show tabular data, line graphs provide a visual representation of how values change across time intervals.
For line graphs, you need a query that returns:
- Time values for the X-axis (typically grouped into intervals)
- One or more numeric fields for the Y-axis (the values to plot)
The graph automatically connects data points with lines, allowing you to see trends, spikes, and patterns at a glance. Multiple fields can be plotted on the same graph for comparison.
For more info on how to write queries, check the query differences for database and query examples
When creating a linegraph query, you always need a "time" field. This is case sensitive for timescale and does not work without it.
Basic example
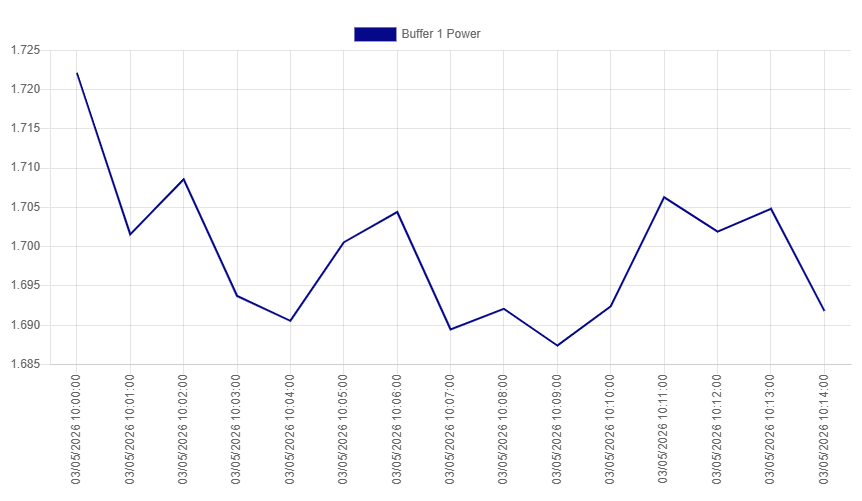
This example shows a single field plotted over time with 1-minute intervals. The query aggregates power values into 1-minute buckets and displays them as a continuous line.
SELECT
  time AS "time",
  MEAN("InputBuffer1_PowerKw") AS "Buffer 1 Power"
FROM "oneWeek"."Line1"
WHERE time >= '2026-05-03T10:00:00+02:00'
  AND time < '2026-05-03T10:15:00+02:00'
GROUP BY TIME(1m)
SELECT
  time_bucket('1 minute', time) AS "time",
  AVG("inputbuffer1_powerkw") AS "Buffer 1 Power"
FROM "docsdemo_timescale_wide"."line1"
WHERE time >= '2026-05-03 10:00:00+02'
  AND time < '2026-05-03 10:15:00+02'
GROUP BY time_bucket('1 minute', time)
SELECT
  time_bucket('1 minute', time) AS "time",
  AVG(value) AS "Buffer 1 Power"
FROM "line1"
WHERE name = 'InputBuffer1_PowerKw'
  AND time >= '2026-05-03 10:00:00+02'
  AND time < '2026-05-03 10:15:00+02'
GROUP BY time_bucket('1 minute', time)
WITH wide_data AS (
  SELECT
    time_bucket('1 minute', time) AS bucket_time,
    AVG(CASE WHEN name = 'InputBuffer1_PowerKw' THEN value END) AS buffer1
  FROM "line1"
  WHERE time >= '2026-05-03 10:00:00+02'
    AND time < '2026-05-03 10:15:00+02'
    AND name = 'InputBuffer1_PowerKw'
  GROUP BY bucket_time
)
SELECT
  bucket_time AS "time",
  buffer1 AS "Buffer 1 Power"
FROM wide_data
Multiple lines
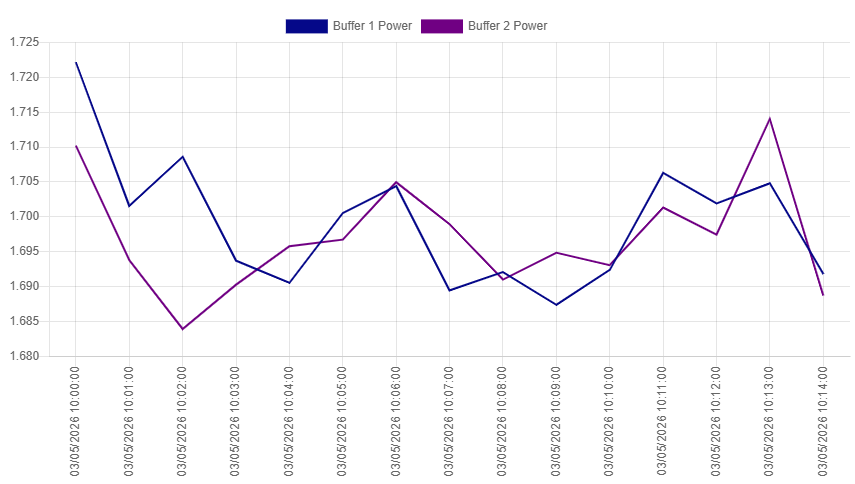
This example plots two fields on the same graph, allowing you to compare trends between Buffer 1 and Buffer 2 power consumption over time.
SELECT
  time AS "time",
  MEAN("InputBuffer1_PowerKw") AS "Buffer 1 Power",
  MEAN("InputBuffer2_PowerKw") AS "Buffer 2 Power"
FROM "oneWeek"."Line1"
WHERE time >= '2026-05-03T10:00:00+02:00'
  AND time < '2026-05-03T10:15:00+02:00'
GROUP BY TIME(1m)
SELECT
  time_bucket('1 minute', time) AS "time",
  AVG("inputbuffer1_powerkw") AS "Buffer 1 Power",
  AVG("inputbuffer2_powerkw") AS "Buffer 2 Power"
FROM "docsdemo_timescale_wide"."line1"
WHERE time >= '2026-05-03 10:00:00+02'
  AND time < '2026-05-03 10:15:00+02'
GROUP BY time_bucket('1 minute', time)
SELECT
  time_bucket('1 minute', time) AS "time",
  AVG(CASE WHEN name = 'InputBuffer1_PowerKw' THEN value END) AS "Buffer 1 Power",
  AVG(CASE WHEN name = 'InputBuffer2_PowerKw' THEN value END) AS "Buffer 2 Power"
FROM "line1"
WHERE time >= '2026-05-03 10:00:00+02'
  AND time < '2026-05-03 10:15:00+02'
  AND name IN ('InputBuffer1_PowerKw', 'InputBuffer2_PowerKw')
GROUP BY time_bucket('1 minute', time)
WITH wide_data AS (
  SELECT
    time_bucket('1 minute', time) AS bucket_time,
    AVG(CASE WHEN name = 'InputBuffer1_PowerKw' THEN value END) AS buffer1,
    AVG(CASE WHEN name = 'InputBuffer2_PowerKw' THEN value END) AS buffer2
  FROM "line1"
  WHERE time >= '2026-05-03 10:00:00+02'
    AND time < '2026-05-03 10:15:00+02'
    AND name IN ('InputBuffer1_PowerKw', 'InputBuffer2_PowerKw')
  GROUP BY bucket_time
)
SELECT
  bucket_time AS "time",
  buffer1 AS "Buffer 1 Power",
  buffer2 AS "Buffer 2 Power"
FROM wide_data
Min/Max range visualization
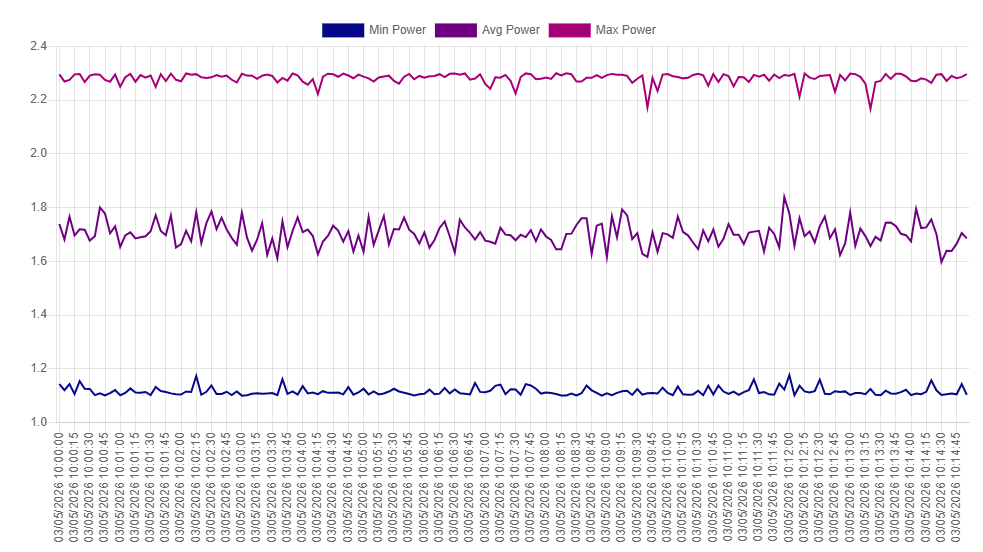
This example shows minimum, maximum, and average values, which can be useful for visualizing data variability and ranges on the graph.
SELECT
  time AS "time",
  MIN("InputBuffer1_PowerKw") AS "Min Power",
  MEAN("InputBuffer1_PowerKw") AS "Avg Power",
  MAX("InputBuffer1_PowerKw") AS "Max Power"
FROM "oneWeek"."Line1"
WHERE time >= '2026-05-03T10:00:00+02:00'
  AND time < '2026-05-03T10:15:00+02:00'
GROUP BY TIME(5s)
SELECT
  time_bucket('5 seconds', time) AS "time",
  MIN("inputbuffer1_powerkw") AS "Min Power",
  AVG("inputbuffer1_powerkw") AS "Avg Power",
  MAX("inputbuffer1_powerkw") AS "Max Power"
FROM "docsdemo_timescale_wide"."line1"
WHERE time >= '2026-05-03 10:00:00+02'
  AND time < '2026-05-03 10:15:00+02'
GROUP BY time_bucket('5 seconds', time)
SELECT
  time_bucket('5 seconds', time) AS "time",
  MIN(value) AS "Min Power",
  AVG(value) AS "Avg Power",
  MAX(value) AS "Max Power"
FROM "line1"
WHERE name = 'InputBuffer1_PowerKw'
  AND time >= '2026-05-03 10:00:00+02'
  AND time < '2026-05-03 10:15:00+02'
GROUP BY time_bucket('5 seconds', time)
WITH wide_data AS (
  SELECT
    time_bucket('5 seconds', time) AS bucket_time,
    CASE WHEN name = 'InputBuffer1_PowerKw' THEN value END AS power_value
  FROM "line1"
  WHERE time >= '2026-05-03 10:00:00+02'
    AND time < '2026-05-03 10:15:00+02'
    AND name = 'InputBuffer1_PowerKw'
)
SELECT
  bucket_time AS "time",
  MIN(power_value) AS "Min Power",
  AVG(power_value) AS "Avg Power",
  MAX(power_value) AS "Max Power"
FROM wide_data
GROUP BY bucket_time